Admin Dashboard
Administrative overview and monitoring tools
Admin Dashboard
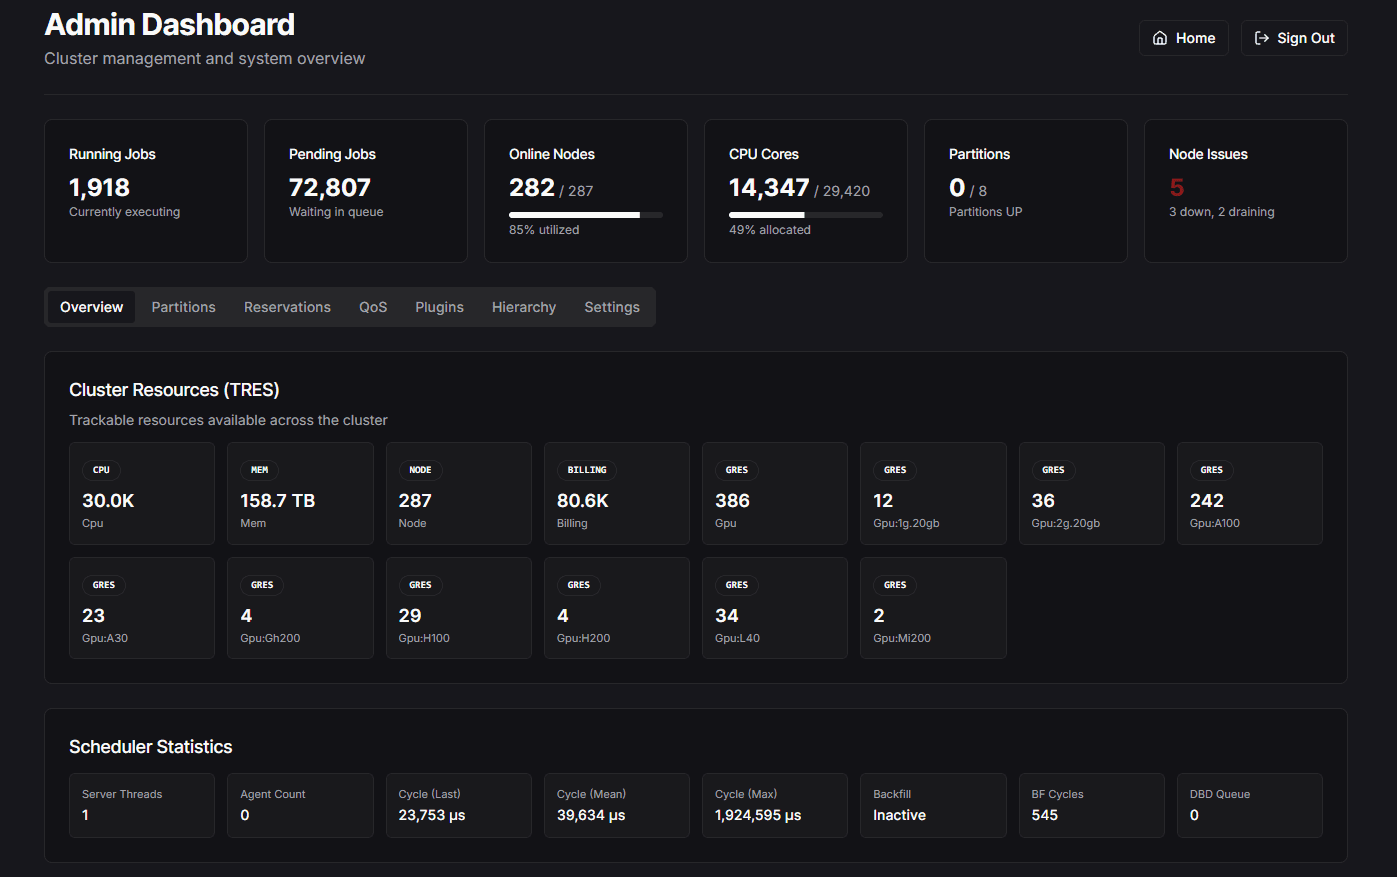
The Admin Dashboard provides a read-only overview of cluster status and key performance indicators for administrators.
Overview
The admin dashboard is designed to give cluster administrators a comprehensive view of system health and usage at a glance. Most information is display-only, with limited configuration options.
Dashboard Panels
Stats
View critical cluster statistics:
- Total cluster utilization
- Active jobs count
- Queue status
- Resource allocation summary
Cluster Status
Monitor the operational status of your cluster:
- Node state distribution
- Partition availability
- Current job distribution
- System health indicators
JWT Token Info
The admin dashboard displays information about your Slurm API JWT token, including:
- Token validity and expiration status
- Time remaining before expiry with color-coded warnings (valid, warning, critical, expired)
- Token username and algorithm details
- Slack notification status for expiry alerts
If a SLACK_WEBHOOK_URL is configured, you can trigger a test notification directly from this card. For automated alerts, set up a cron job to call the alert endpoint:
# Daily at 9am — check token and send Slack alert if expiring soon
0 9 * * * curl -s "https://your-dashboard/api/slurm/jwt/alert"
Related environment variables:
SLACK_WEBHOOK_URL=""                          # Slack incoming webhook URL
SLURM_TOKEN_EXPIRY_WARNING_DAYS="30"          # Days threshold for alerts
GPU Analysis
When both the GPU Utilization and Job Metrics plugins are enabled, a "GPU Analysis" tab appears in the admin dashboard. This panel provides:
- System-level GPU overview — average utilization, underutilized job count, wasted GPU hours
- Per-job GPU table — sortable by job ID, user, utilization, or GPU count
- Search and filter — find specific jobs or filter to show only underutilized jobs (below 30%)
- Auto-refresh — data refreshes every 60 seconds
GPU Analysis Requirements:
The GPU Analysis tab requires both NEXT_PUBLIC_ENABLE_GPU_UTILIZATION="true" and NEXT_PUBLIC_ENABLE_JOB_METRICS_PLUGIN="true" in your .env file.
LLM Config
The LLM Config tab provides a visual editor for the AI assistant's YAML configuration (infra/llm-assistant.yaml). From this panel you can:
- Cluster Identity — Edit your cluster name, organization, documentation URL, and support email
- System Prompt — Customize the AI's behavior rules, formatting preferences, and safety instructions
- Job Defaults — Set default partition, QoS, walltime, and output patterns for sbatch script generation
- Custom Instructions — Add organization-specific guidance the AI should follow
- Restricted Topics — Define topics the AI should redirect to support channels
- Tools — Enable/disable built-in tools, create custom tools with Slurm REST, SlurmDB, or HTTP execution endpoints
- Raw YAML Editor — Switch to a raw editing mode for advanced configuration
- Test Chat — Preview changes with the built-in chat interface
Changes saved through this panel are written directly to infra/llm-assistant.yaml and take effect within 60 seconds.
Configuration File:
The YAML config path can be customized via the LLM_CONFIG_PATH environment variable (defaults to infra/llm-assistant.yaml). See AI Chatbot Integration for the full configuration reference.
Plugin Status
View which dashboard plugins are currently enabled:
- AI Chat Assistant
- Prometheus Integration
- GPU Utilization
- InfluxDB Integration
- Job Metrics Dashboard
- Historical Data
- Modules Browser
Plugin Configuration:
Plugin settings are configured in the .env file and require a server restart to take effect. The admin dashboard displays current plugin status but does not modify settings.
Hierarchy Configuration
The admin dashboard includes tools for configuring organizational hierarchy for the job metrics feature:
- Define organizational structure (colleges, departments, etc.)
- Manage hierarchy labels
- Configure data groupings
For detailed information on setting up hierarchy, see Job Metrics Hierarchy Configuration.
Access Control
Authentication Required:
The Admin Dashboard requires authentication. Access credentials are configured in your .env file:
ADMIN_USERNAME="admin"
ADMIN_PASSWORD="password"
Ensure you change the default password in production environments.