Job Metrics Reporting
Overview of the Job Metrics Dashboard for Slurm
Job Metrics Reporting

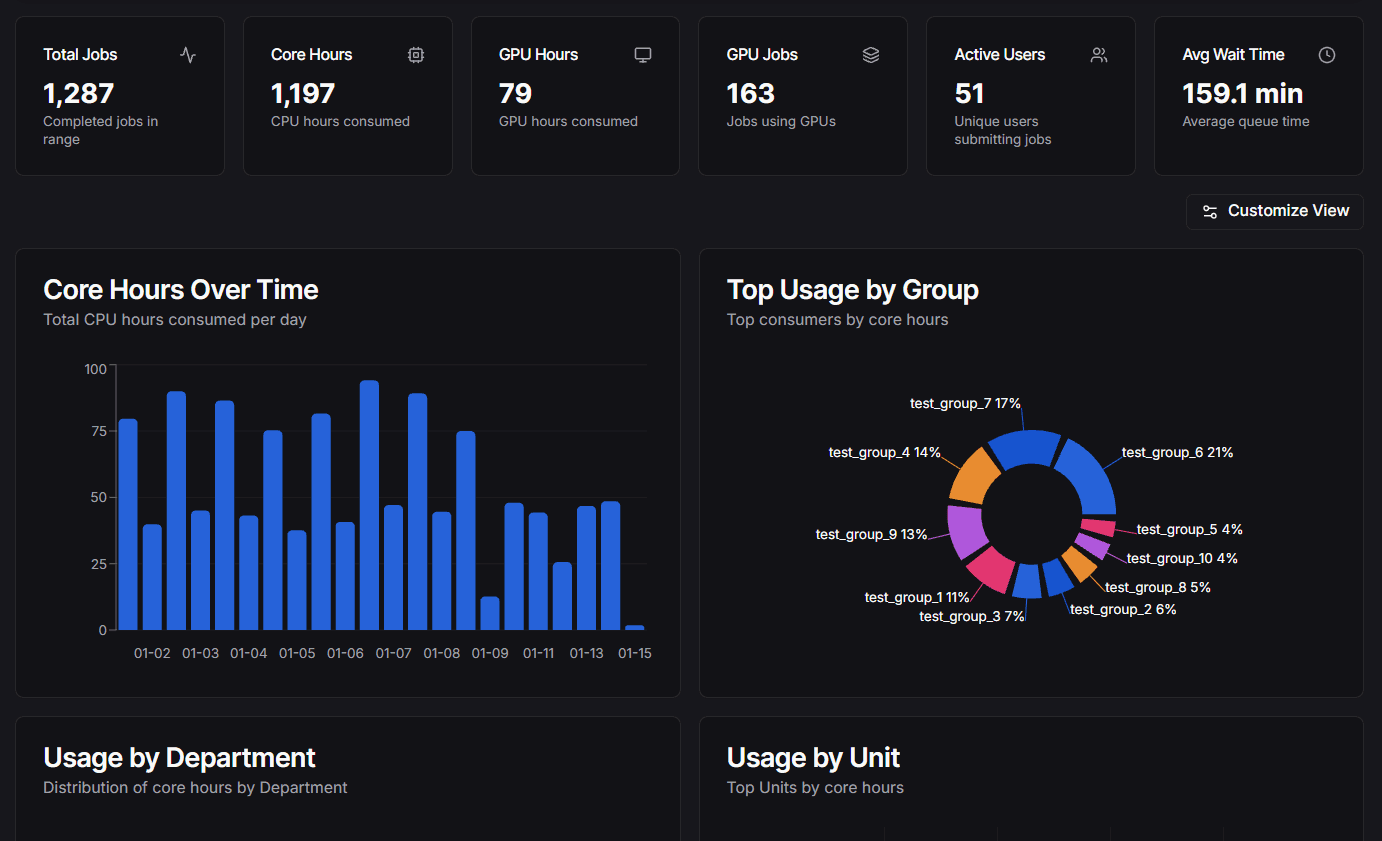
The Job Metrics Dashboard provides a comprehensive view of job details tailored specifically for Slurm. It serves as a lightweight analytics tool to provide insights into cluster usage, efficiency, and user activity.
This feature allows administrators and users to visualize job metrics, analyze historical data, and generate reports based on Slurm job accounting data collected by the Slurm History Ingestor.
Enabling the Plugin
To enable the Job Metrics Dashboard, add the following to your .env file:
NEXT_PUBLIC_ENABLE_JOB_METRICS_PLUGIN=true
Key Features
- Job Details: Detailed metrics for individual jobs including wait times and exit codes.
- Cluster Usage: Overview of core hours, job counts, and wait times over time.
- User Activity: Insights into active users, groups, and account usage.
- Visualizations: Graphs and charts for core hours over time, usage by group, and more.
Architecture
The system consists of two main parts:
- Slurm History Ingestor (Go Scraper): A standalone service that fetches job history using sacct (primary method) or the Slurm REST API (fallback) and stores it in a PostgreSQL database.
- Dashboard Plugin: A frontend component within this Next.js application that queries the database to visualize the metrics.
What Gets Populated Where
The Slurm History Ingestor only syncs job data from Slurm. Other data sources are populated separately:
| Data | Source | How It's Populated |
|---|---|---|
Job history (job_history) | Slurm (sacct/API) | Automatically by the Go ingestor |
Users (users) | Slurm (sacct/API) | Automatically by the Go ingestor |
Accounts (accounts) | Slurm (sacct/API) | Automatically by the Go ingestor |
Organizations (organizations) | Your institution | Imported via Admin page or CSV |
Account mappings (account_mappings) | Your institution | Imported via Admin page or CSV |
GPU metrics (job_gpu_metrics) | Prometheus/DCGM | Captured via /api/gpu-metrics/capture endpoint |
Important:
The ingestor is intentionally focused only on Slurm job data. Organizational hierarchy is institution-specific metadata that must be imported separately. GPU metrics come from Prometheus, not Slurm.
Requirements
To enable the Job Metrics Dashboard, you need:
- Go Scraper: Installed and running. See Go Scraper.
- PostgreSQL Database: To store the collected metrics.
- Plugin Configuration: Enable the plugin as shown above.
Please refer to the Installation and Configuration guides for detailed setup instructions.
Hierarchy Configuration
The job metrics dashboard uses organizational hierarchy to group and filter data by department, college, or other organizational units. This is institution-specific metadata that is not populated by the Slurm History Ingestor — it must be configured separately via the Admin dashboard or CSV import.
For full details on setting up, importing, and managing your organizational hierarchy, see the Organization Hierarchy guide.
Historical GPU Metrics
The Job Metrics plugin can be enhanced to capture and store GPU utilization metrics for completed jobs. This enables:
- GPU Efficiency Grades: A-E grades based on GPU utilization patterns
- Historical Analysis: View GPU usage data for completed jobs
- Performance Tracking: Monitor average, peak, and memory utilization
- Trend Analysis: Analyze GPU usage patterns over time
Prerequisites for GPU Metrics
Before enabling GPU metrics, ensure you have:
- GPU Utilization Plugin: The base GPU utilization setup from GPU Utilization Reporting
- Prometheus: Configured with DCGM exporter and recording rules
- Metrics Database: A PostgreSQL database for storing job history (used by Job Metrics plugin)
Setup Steps
Step 1: Enable GPU Metrics Plugin
Add these environment variables to your .env file:
NEXT_PUBLIC_ENABLE_JOB_METRICS_PLUGIN=true
NEXT_PUBLIC_ENABLE_GPU_UTILIZATION=true
SLURM_JOB_METRICS_DATABASE_URL="postgresql://user:password@host:5432/database"
PROMETHEUS_URL="http://your-prometheus-host:9090"
Step 2: Verify Database Migration
The Slurm History Ingestor is a separate service/repository. Make sure it is installed and configured, and that the GPU metrics migration (003_add_gpu_metrics.sql) was applied during the ingestor setup.
Verify the table exists in your metrics database:
psql -h YOUR_DB_HOST -U YOUR_DB_USER -d YOUR_DB_NAME -c "\d job_gpu_metrics"
If the table doesn't exist, apply the GPU metrics migration from the Slurm History Ingestor docs and re-run the check. See the Go Scraper installation guide for the correct migration steps.
Step 3: Set Up Metrics Capture
Create a capture script that will be called periodically by cron:
#!/bin/bash
# GPU Metrics Capture Script
# Captures current GPU utilization for all running jobs
# and stores in the database for historical access after jobs complete
curl -s "http://localhost:3020/api/gpu-metrics/capture"
Save this as /path/to/gpu-capture.sh and make it executable:
chmod +x /path/to/gpu-capture.sh
Step 4: Configure Cron Job
Add to your crontab to run every 5 minutes:
*/5 * * * * /path/to/gpu-capture.sh >> /var/log/gpu-capture.log 2>&1
Or edit crontab directly:
crontab -e
Rate Limiting:
The endpoint is rate-limited to 1 capture per minute. Repeated calls within the limit return HTTP 429 with no side effects, making it safe to call more frequently if needed.
Step 5: Verify Setup
Check the capture endpoint:
curl http://localhost:3020/api/gpu-metrics/capture
Expected response:
{
"status": 200,
"message": "GPU metrics capture complete",
"captured": 3,
"updated": 2,
"markedComplete": 1
}
Check database for captured metrics:
SELECT job_id, avg_utilization, gpu_count, last_seen, is_complete
FROM job_gpu_metrics
ORDER BY last_seen DESC
LIMIT 10;
View a completed GPU job in the dashboard - you should see GPU efficiency grades and utilization stats.
How It Works
While jobs are running:
- Cron calls
/api/gpu-metrics/captureevery 5 minutes - Endpoint queries Prometheus for all active GPU jobs using recording rules
- Metrics are upserted into
job_gpu_metricstable with running averages - Jobs are tracked until they complete
When jobs complete:
- After 10 minutes of no metrics, jobs are marked
is_complete = true - Historical job detail views query the database instead of Prometheus
- GPU efficiency grades are calculated from stored averages
Query priority:
- Running jobs: Dashboard queries Prometheus first (live data)
- Completed jobs: Dashboard queries database (historical data)
Troubleshooting
No metrics being captured:
-
Verify Prometheus is accessible and DCGM exporter is running:
curl http://your-prometheus-host:9090/api/v1/targets -
Check that DCGM metrics exist in Prometheus:
curl -s 'http://your-prometheus-host:9090/api/v1/query?query=DCGM_FI_DEV_GPU_UTIL' | jq -
Ensure cron job is running:
grep gpu-capture /var/log/cron.log
Database errors:
-
Verify the database connection string:
psql "$SLURM_JOB_METRICS_DATABASE_URL" -c "SELECT COUNT(*) FROM job_gpu_metrics;" -
Ensure migration was applied successfully:
psql "$SLURM_JOB_METRICS_DATABASE_URL" -c "\d job_gpu_metrics"
Historical jobs not showing GPU stats:
- Verify the job was running when capture was active
- Check if metrics exist:
psql "$SLURM_JOB_METRICS_DATABASE_URL" -c "SELECT * FROM job_gpu_metrics WHERE job_id = 'YOUR_JOB_ID';" - Ensure both plugins are enabled in
.env - Check that the job has completed (should be marked
is_complete = true)